Explore and learn about the world in a boundary-crossing lab.
Time for exploranation
Do you want to know how your eating habits affect the climate? Or how all animals are connected in the food chain?
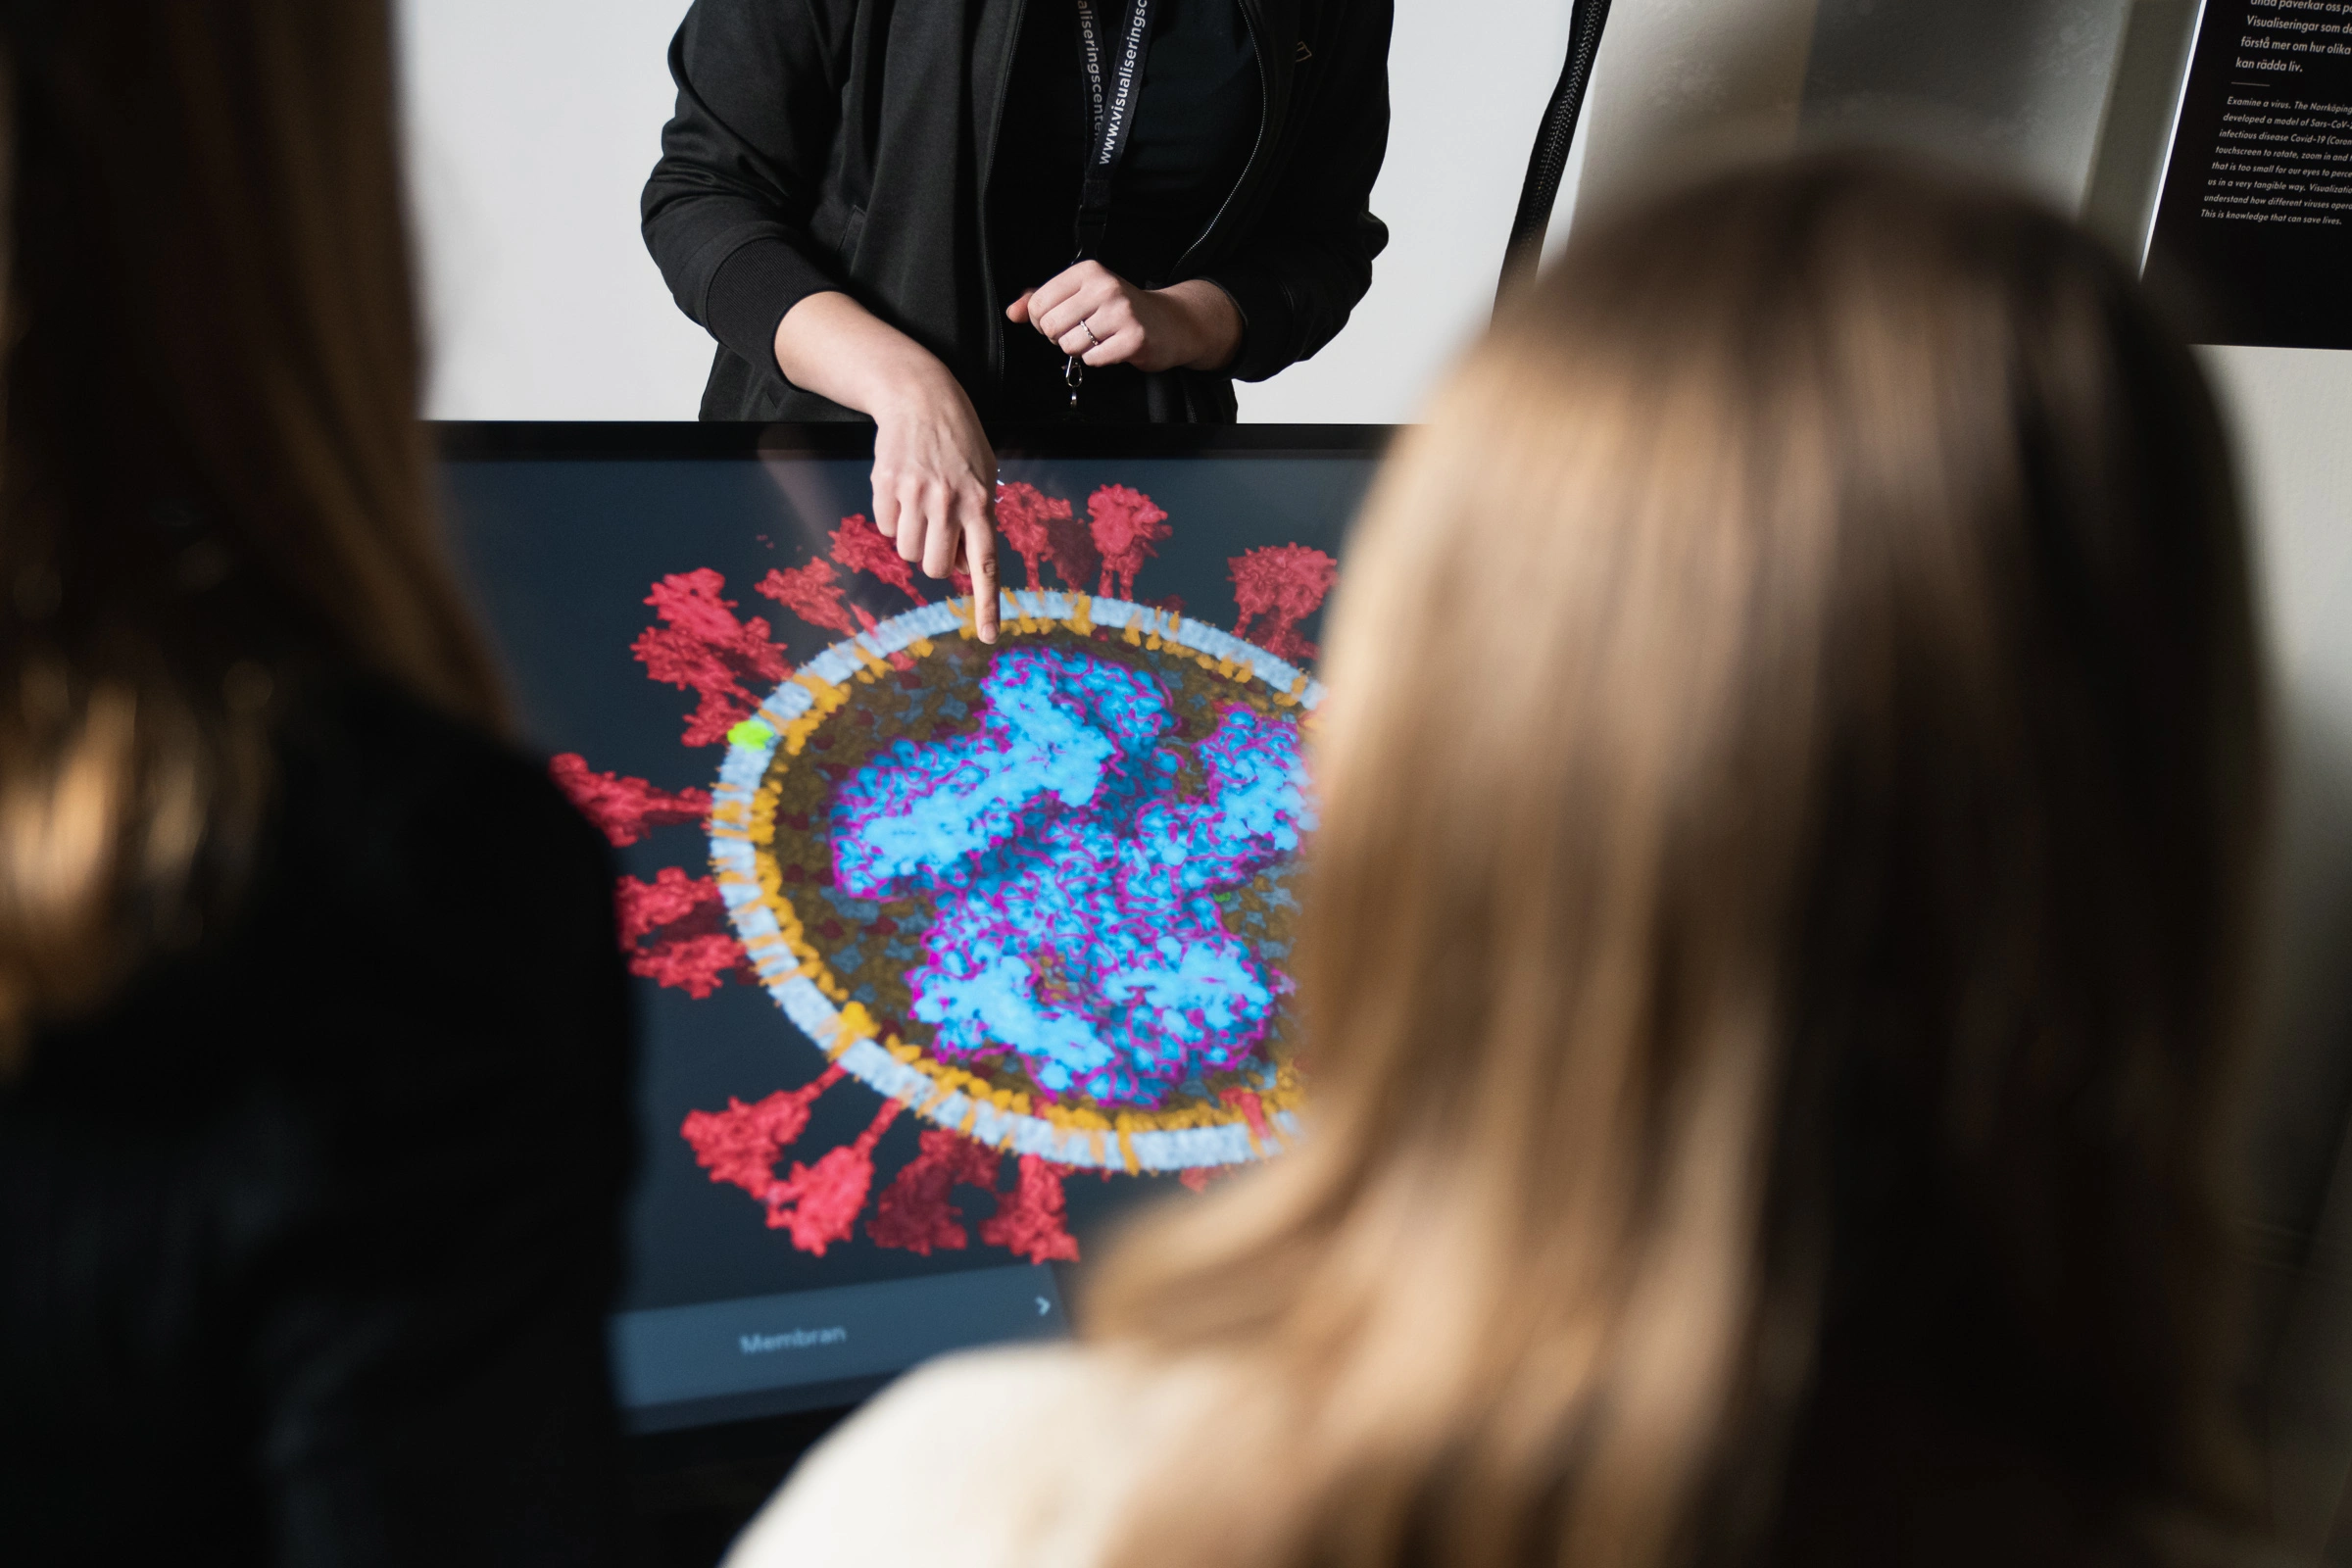
In Wadström’s Exploranation Laboratory, you use research visualization to make new discoveries (exploration) while also getting explanations for the research results (explanation). This is what we call exploranation. You get direct access to the data that researchers use. It will spark curiosity and a joy of exploration, giving you completely new knowledge.
Our lab and learning environments are always free to enter! Welcome!
Explore
From climate change to the ocean’s ecosystem. Dive into the lab’s various stations.
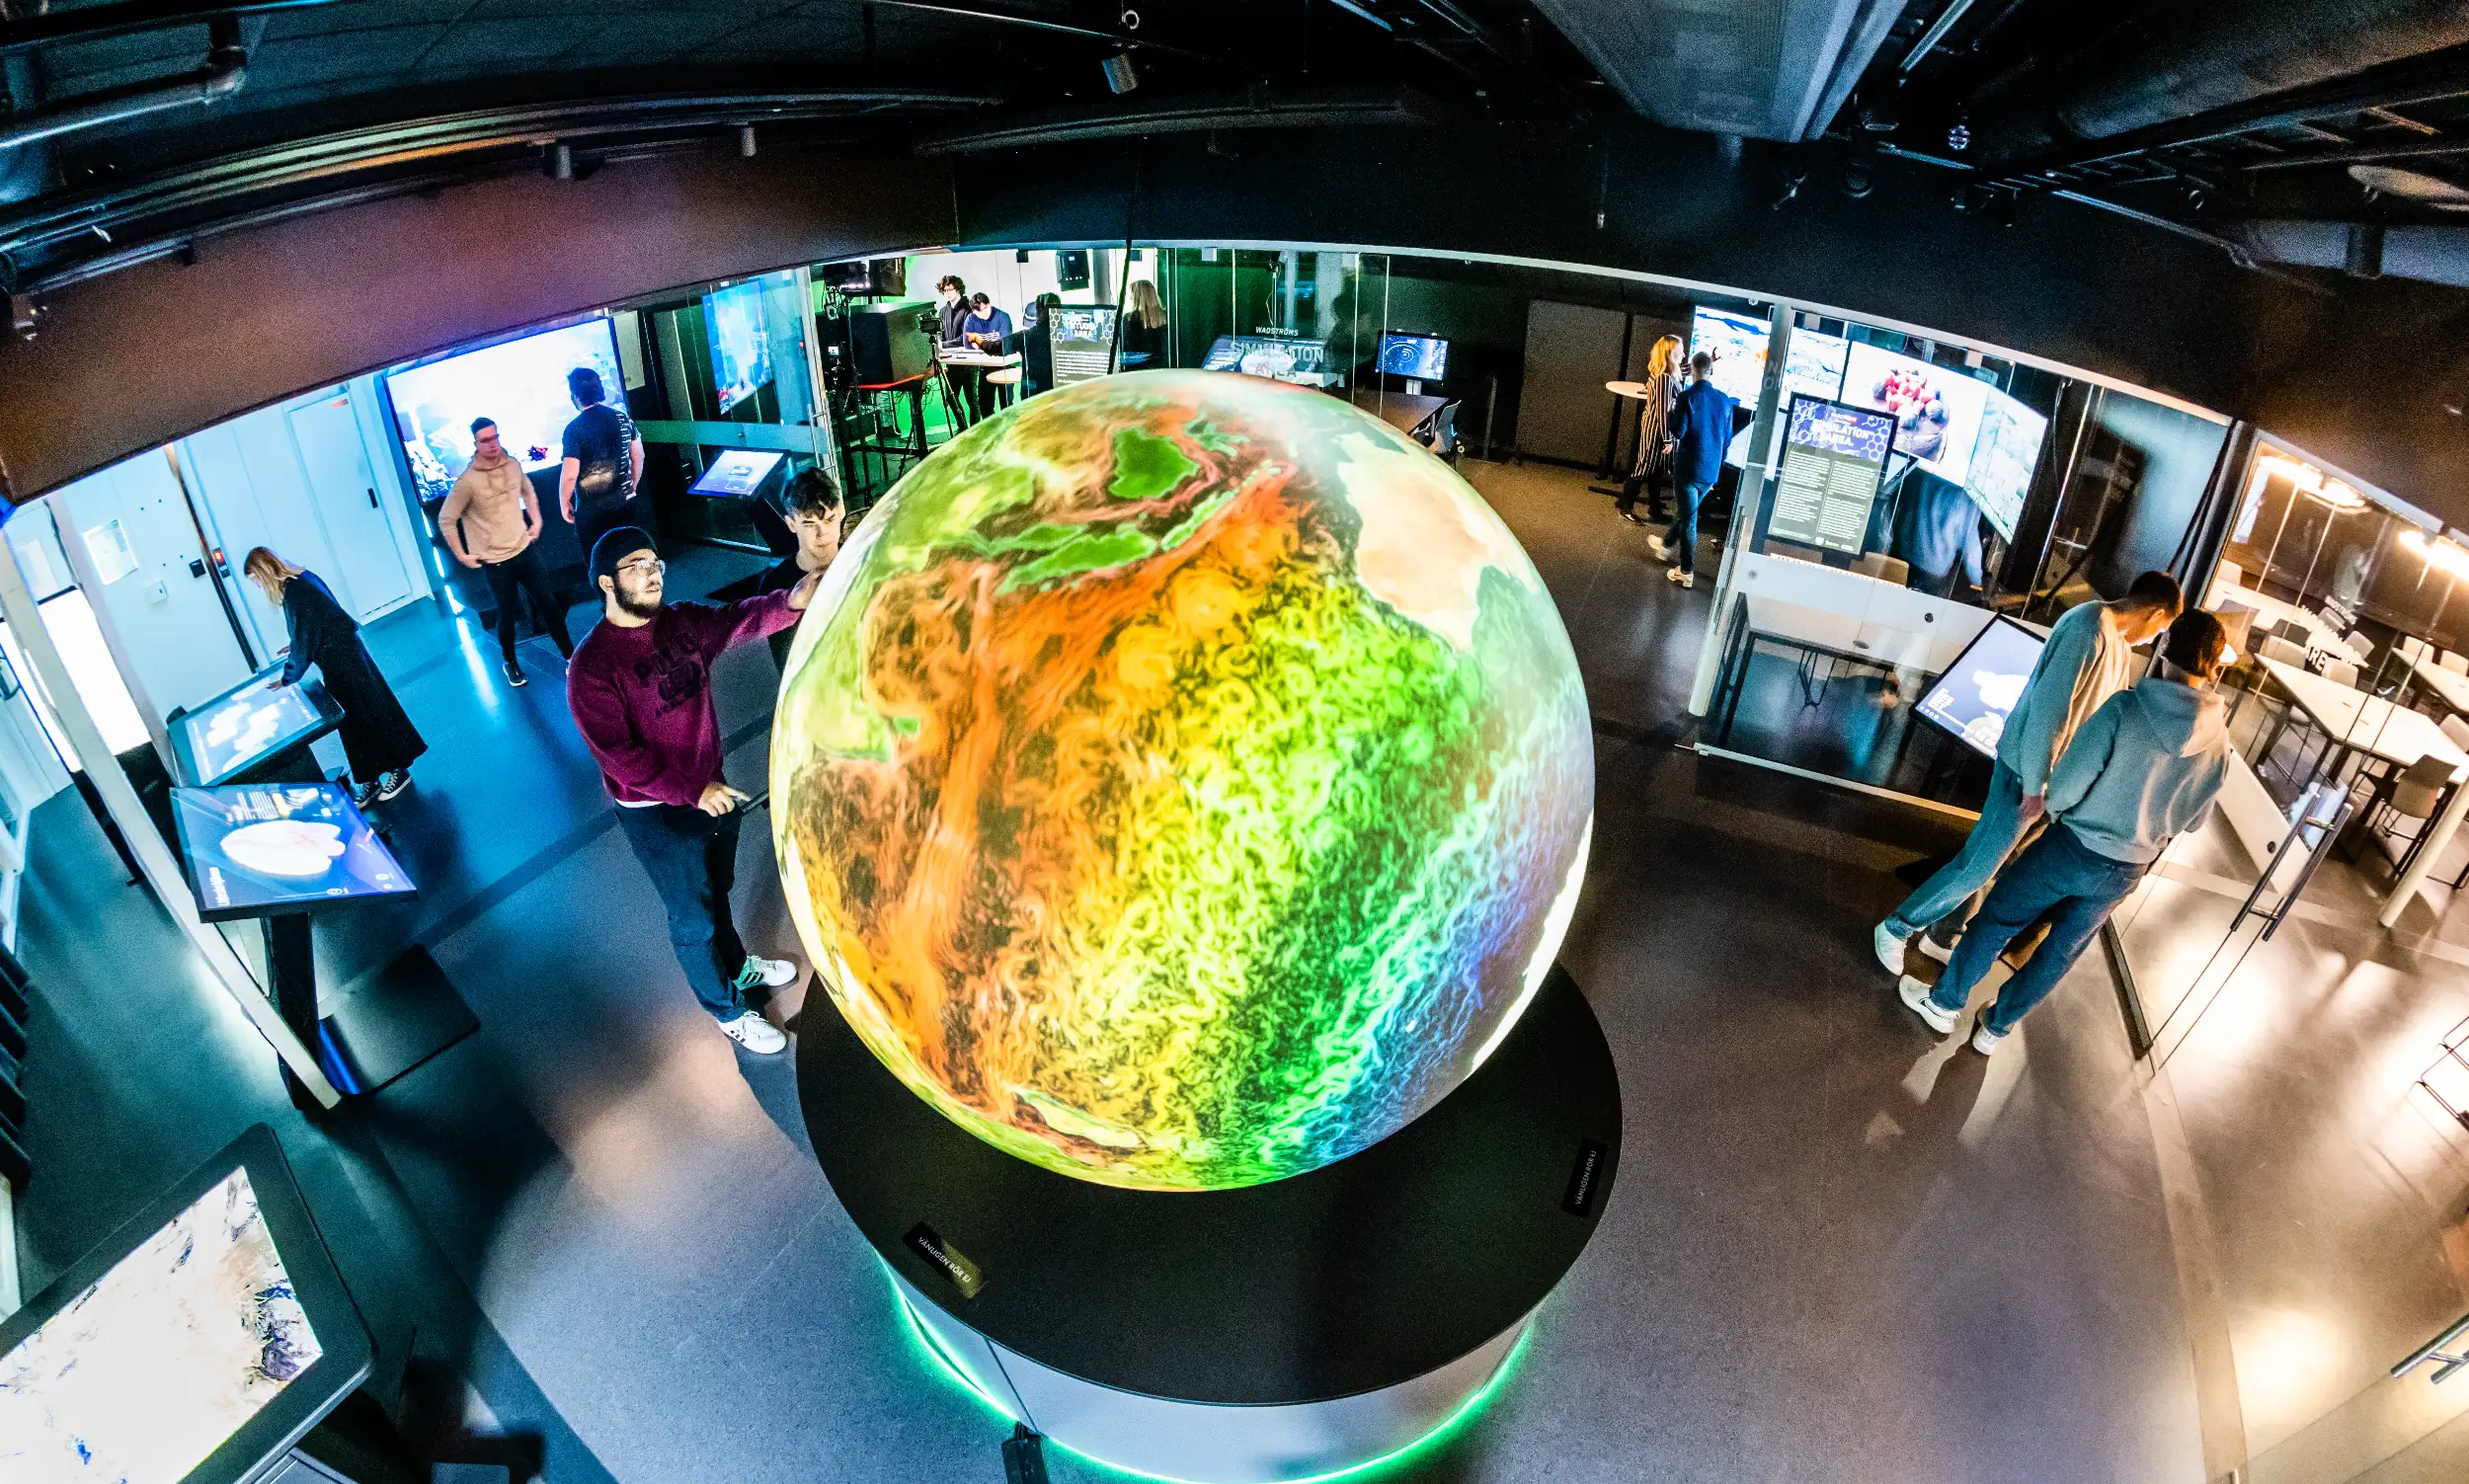
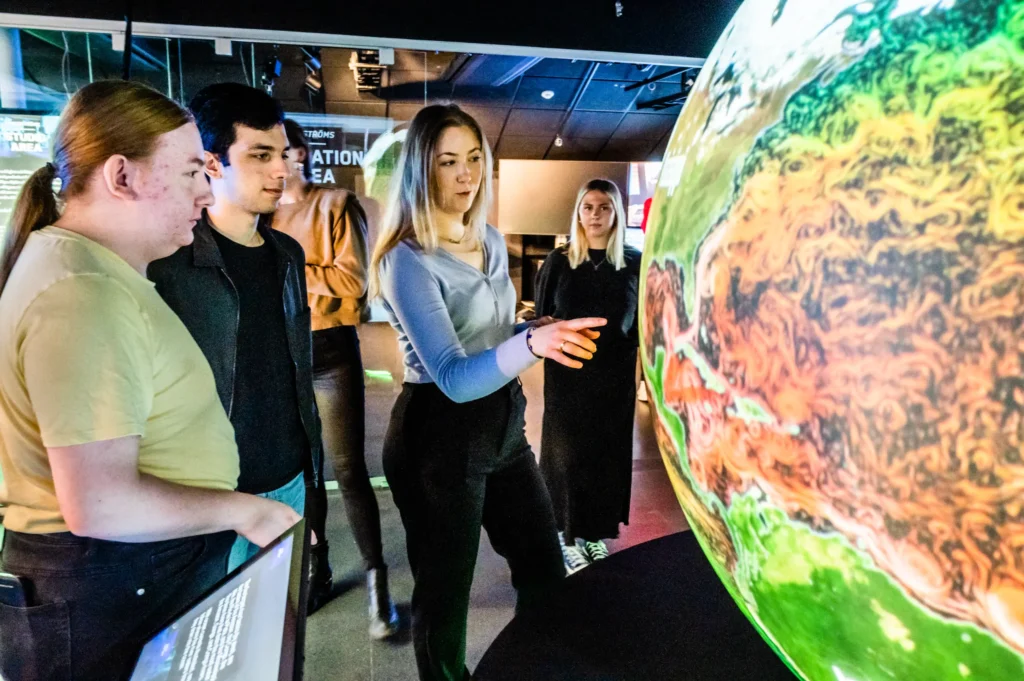
The spherical globe in the middle of the 5th floor visualizes Earth’s climate changes. Here, you can explore changing climate data and understand how our planet might look in the future.
Where can we live in 2070? What will the air temperature be like? And the sea – how warm will it be? Climate and Earth system models are used for a variety of purposes – from studying the dynamics of past weather and climate systems to projecting future climate.
These models simulate the physics, chemistry, and biology of the atmosphere, land, and sea, and require massive supercomputers to generate climate projections. An international team of climate scientists, economists, and Earth system modelers has built a range of new “pathways” that explore how global society, demographics, and economics might change over the next century. They are collectively known as “Shared Socioeconomic Pathways” (SSP).
A food web describes who eats whom in an ecosystem. By visualizing it, we can understand what happens when something changes in the system. If a species disappears or the environment changes, the whole chain is affected because all species are interconnected.
In this visualization, the food web of the Serengeti, located in northern Tanzania in eastern Africa, is described. The web consists of 161 species and 592 links between species. Here, you can explore which animal takes the most prey or how climate change affects the Serengeti ecosystem.
By describing an ecosystem as a web or network, we can visualize how energy flows between different species and how they affect each other, both directly and indirectly.
To simulate how species populations change over time, the Lotka-Volterra equation is used. The equation describes how dynamics change in a biological system where two species interact, predator and prey.
When there are many prey animals, predators thrive, but after a while, the number of prey animals will not be enough for the predators’ food needs. The number of predators decreases, and the prey population increases again. Growth and decline follow each other in dynamic cycles.
Take a plate, serve your food, and see what happens to the climate! You probably know that what you eat affects the environment – but how and why? And how can you contribute to climate improvement through conscious choices?
Here, you can examine the amount of greenhouse gas emissions for common food items and learn more about how to think climate-smart about the food you buy, cook, and eat.
Here, we see how food items affect the climate based on carbon dioxide equivalents, land use, and water consumption. The dataset has been developed by Sweden’s largest research program on sustainable consumption, Mistra Sustainable Consumption – from niche to mainstream.
The program aims to contribute to the climate transition through increased knowledge of how sustainable consumption can be scaled up and adopted by more people. The installation is developed here at Visualiseringscenter C by the immersive visualization group at Linköping University.
Here, you are literally close to the research – researchers and developers are actually sitting behind the door by the elevator.
The Weddell Sea is located off the coast of Antarctica, between latitudes 74°S and 78°S. The sea depth varies between 200 and 500 meters, and the shallower parts are covered by ice. But beneath the surface lies a large and complex ecological network – and here you can explore it. What species are in the sea? How are they connected to each other, who eats whom? You can modify the system yourself by removing species and following the consequences for the rest of the ecosystem. Maybe you can find connections between decreasing ice masses and the presence of krill, or see why phytoplankton play such an important role for the large carnivores.
In this visualization of the marine food web, there are 489 species and nearly 16,000 feeding interactions. It is based on research articles and expeditions where animals were observed and their stomach contents examined.
The Arctic and Antarctica are the least observed regions in the world – and at the same time, these sensitive polar areas are key factors for the Earth’s climate. In the last fifty years, temperatures in the Arctic have increased twice as fast as in the rest of the world. But lack of data and limited models affect the quality of forecasts for both hemispheres. Thanks to advances in simulation, improved weather forecasts and climate predictions can be developed – leading to new insights.
Here, we visualize climate data collected continuously, with an extra focus on our nearest polar region, the Arctic. As a visitor, you can explore what happened during a mission in April 2020, aboard the icebreaker Polarstern.
The visualization was developed by Visualiseringscenter C in collaboration with NASA and others, using the OpenSpace software. It is based on research from SeRC – Swedish e-Science Research Centre.
Kosterhavet is the marine area in Sweden with the greatest biological diversity and is Sweden’s first national park for life beneath the surface. Here you can find images and data collected by the University of Gothenburg, Department of Marine Ecology – Tjärnö, during the years 1997-2008.
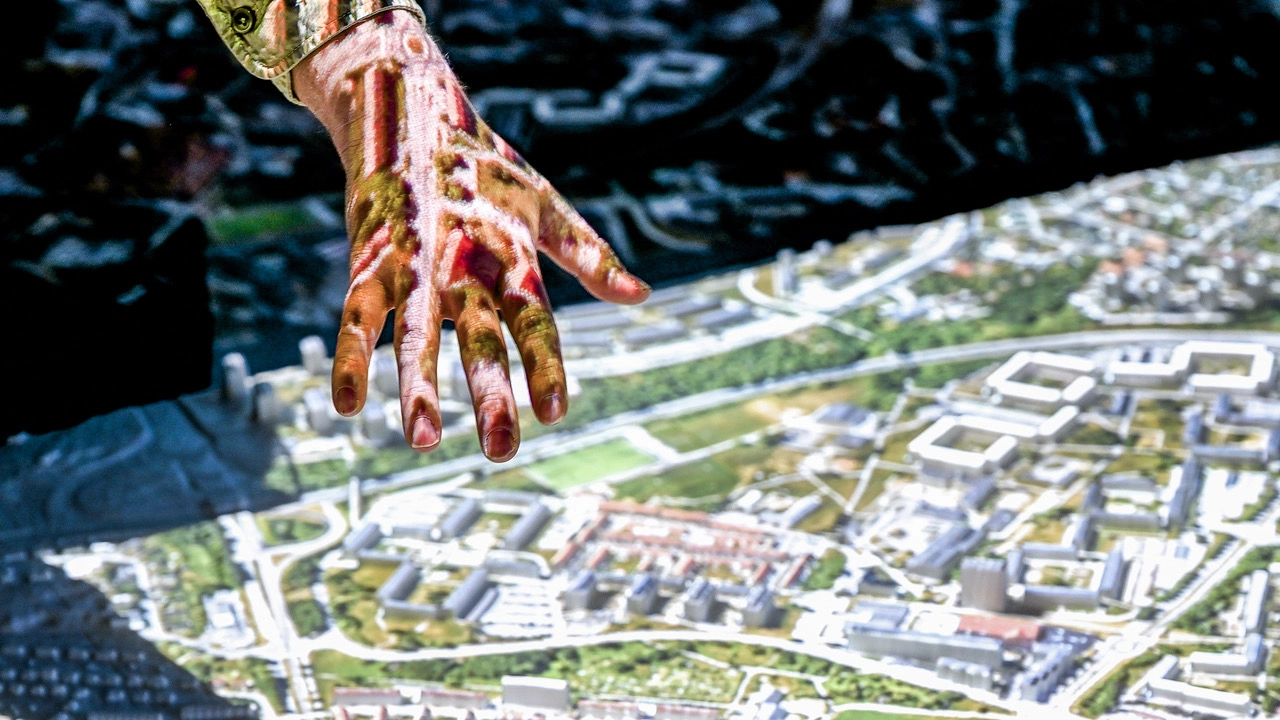
In Norrköping’s inner harbor, one of the first gasworks in Sweden was built in the 1800s, to provide light for the flourishing textile industry. Since then, the city has grown and changed, and the old harbor area that was once an industrial area on the outskirts of the city is now becoming a new residential area.
Here you can explore the area’s history, take part in the city’s largest excavation, and see the future district taking shape where old quays once stood. With the help of visualization, you can browse between the past, present, and future. You can pan and zoom in the map – and look underground by selecting a theme in the menu at the bottom. We call it Earth Autopsy – the ability to see and understand soil contamination data and how we can clean it up, because what was buried yesterday must be dealt with today.
Interspectral, a spin-off company from Visualiseringscenter C, developed Inside Explorer, which in this case has been used by Norrköping’s urban planning department. Data from drones, bore samples, CAD drawings, and historical maps have been combined to create a unique view where we can explore the past, present, and future of a district in transition.
This area is mainly used by researchers and students in courses at the Master of Science in Media Technology program at Linköping University. Here, students and researchers can conduct experiments in multisensory rendering, visualization, and interaction. Here, there are HMDs (Head Mounted Displays) to step into virtual environments, as well as advanced equipment with view-corrected stereoscopic display technology and haptic display technology.
The equipment in this space is very sensitive. Special permission is required to handle it.

Conference
Let Wadström’s Exploranation Laboratory be a part of your meeting or conference with us at Visualiseringscenter C. Our educators will guide you and deepen your experience of the installations in the lab and learning environment. Read more about conferences here.
School Programs
Want to visit Wadström’s Exploranation Laboratory with your school class? Our educators will guide you based on the students’ level of knowledge. Read more about school visits here.

About the Lab
Wadström’s Exploranation Laboratory is based on the research conducted at Visualiseringscenter C and Linköping University. The lab and learning environment are made possible thanks to a generous donation from the Stig Wadström Foundation.