Welcome into the body, art, and history.
See the inside of reality
Seeing all the layers of a human being, physically, has been reserved for medical research. As well as closely examining the world’s greatest artworks or our most exciting historical artifacts.
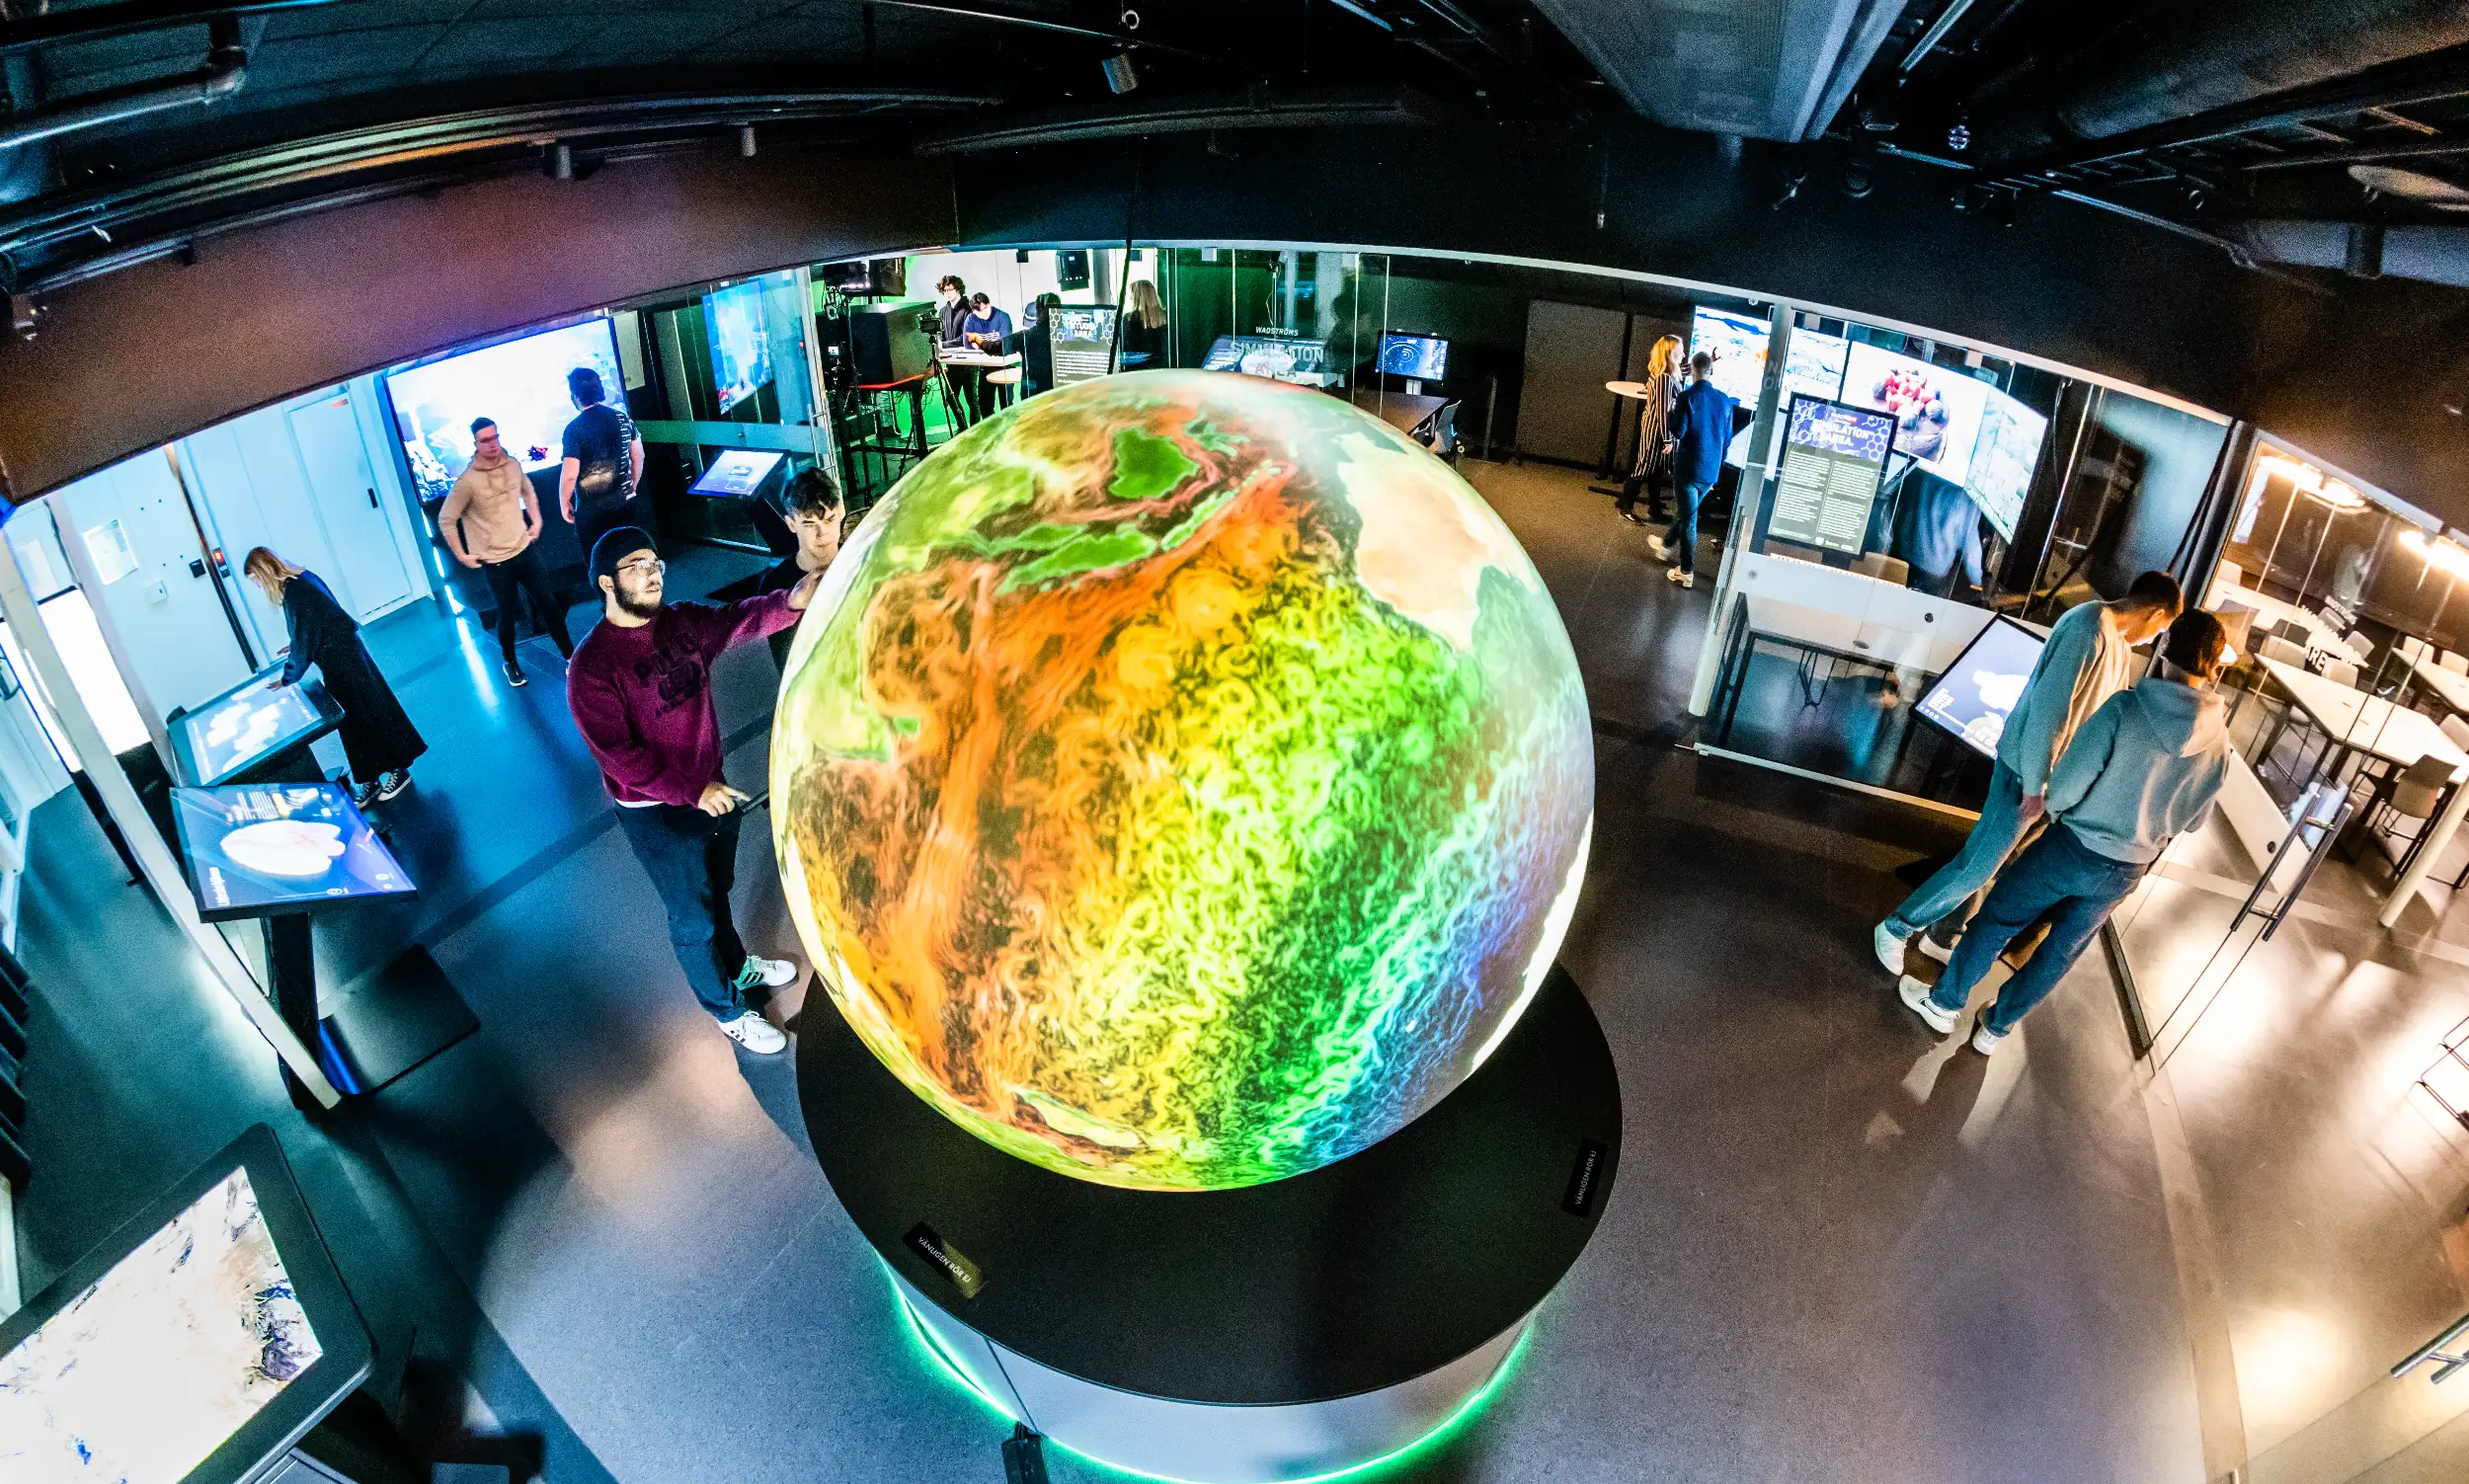
Thanks to the cutting-edge research in visualization conducted at Visualiseringscenter C, we can offer anyone the opportunity to explore and understand the world in the Insights lab and learning environment.
Our lab and learning environments are always free to enter! Welcome!
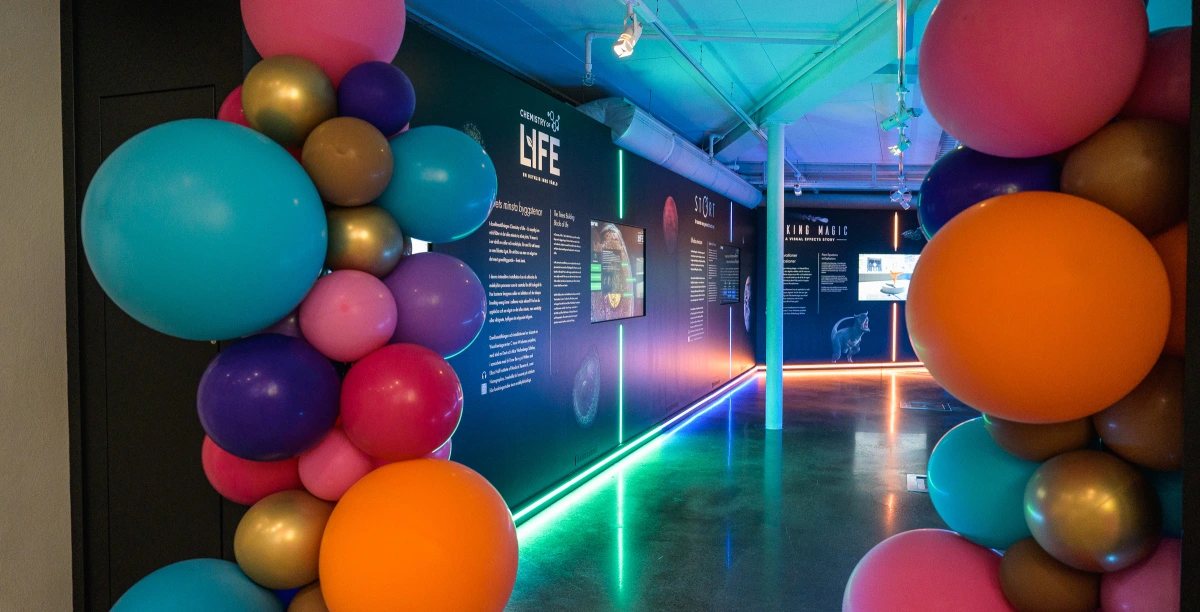
Explore
From the human body to world art – let your own curiosity lead you.
A murder has been committed – can you find the culprit? In Visual Crime Scene, you take on the role of the police and solve a murder mystery.
The installation was developed in collaboration with Visual Sweden, the Police, East Sweden Game, Lutra Interactive, Linköping University, Santa Anna IT Research Institute, AI Sweden, and Region Östergötland. Visual Crime Scene was developed as a demonstrator for new working methods in crime scene investigations.
Inside Explorer began as a research project at Linköping University and the Norrköping campus. Today, the software is used worldwide. Using data from computed tomography (CT) and interactive volume rendering software, we can explore the inside of humans, animals, and objects. How does a heart pump work and what does an ant or a rock from Mars look like inside? Browse and choose from the objects. Use the touchscreen to zoom, rotate, and turn the object. By dragging the scissors symbol, you can see the object in cross-section.
The Human Organ Atlas is an interactive 3D installation with data developed by ESRF, made technically possible by Interspectral’s state-of-the-art 3D visualization software. The software focuses on four key organs: brain, lungs, kidneys, and spleen. Each section provides valuable information about the organ’s structure, function, and significance in the human body – something that can revolutionize medical research and spark interest in science.
What does a normal heart look like, what are its different parts, and how does it work? How does a healthy heart differ from a diseased one, and are there differences between a young and an old heart?
These are some of the questions you can explore in this installation. Many are familiar with the image of a heart in 2D. It is usually depicted from the same angle and with a specific color scheme to highlight the heart’s different parts and functions. This model has been present in most textbooks over the years, and many medical websites still use this simple representation.
In the installation, you can explore the heart’s real anatomy and get a more realistic view of how a heart looks and how different hearts can vary.
Touch a real brain and see how it works! Our consciousness is shaped by numerous processes occurring in the brain every second, and understanding these processes is one of medical science’s greatest challenges. In this installation, real data from several MRI scans are shown in a single visualization. Through MRI (Magnetic Resonance Imaging), we get information about the brain’s structure. Functional MRI (fMRI) shows where in the brain blood flow, and thus oxygen supply, increases. DTI (Diffusion Tensor Imaging) allows measurement of fluid diffusion in tissues. Find out which parts of the brain interact when we, for example, count, talk, or move different body parts. Use the buttons and controls to highlight different areas of the brain, see cross-sections, and switch between various activities.
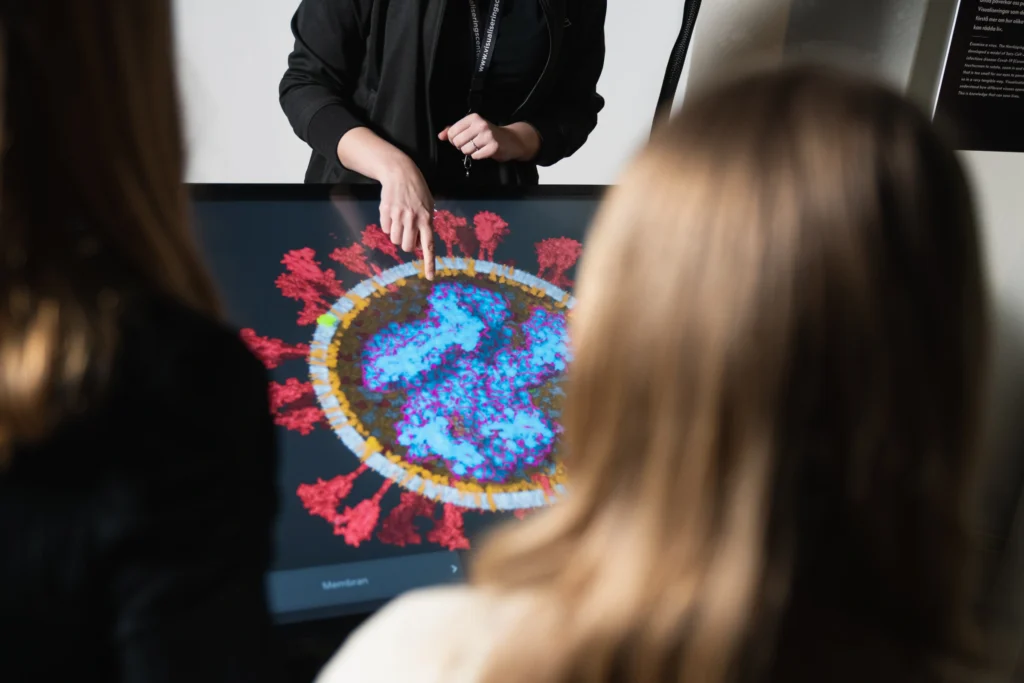
COVID-19 is an infectious disease caused by the Sars-CoV-2 virus. In this installation, we can look at the virus, which is actually too small for our eyes to perceive, but still affects us significantly. Visualizations like this can help us all understand more about how different viruses work. Knowledge that can save lives.
Illusion or reality? Using high-resolution screens and optical glass, an illusion is created that makes your brain believe you see a three-dimensional object floating in the air. With the help of holograms, we can push the boundaries of how we visualize the world around us. Explore the exciting content in our Diamond.
Computed tomography (CT) is not just for the present. Examine Egypt’s holiest symbols, learn more about advanced embalming techniques, and see the over 2000-year-old mummy still lying there, surrounded by coffins, cloth, and amulets. Rotate and turn the objects on the table, use the scissor symbols to see cross-sections, and switch between different layers in the list at the bottom. Maybe you can decipher some of the still unsolved mysteries?
Can you touch a painting? Here you can get closer to art with the help of technology. There are no barriers or glass cases in the way. Explore the virtual version of the artwork Vertumnus by zooming, panning, switching filters, shining with a virtual flashlight, and seeing with your own eyes at your own pace. Under the info points that appear as you get closer, you’ll find more information about the mysterious painting. More about Vertumnus preserved at Skokloster Castle
Compete in relaxation? Yes, because in the game Mindball, the player who thinks the least wins! The headband registers two different types of brainwaves that the brain sends out when we are calm. It is the brainwaves that make the ball move into the opponent’s goal. The most relaxed player wins!
Through photogrammetry and 3D scanning technology, there is now the possibility to closely examine things that otherwise cannot be touched. Examine the details on Gustav Vasa’s helmet from 1540 or get the feeling of wearing Erik XIV’s 20.6 kg armor.
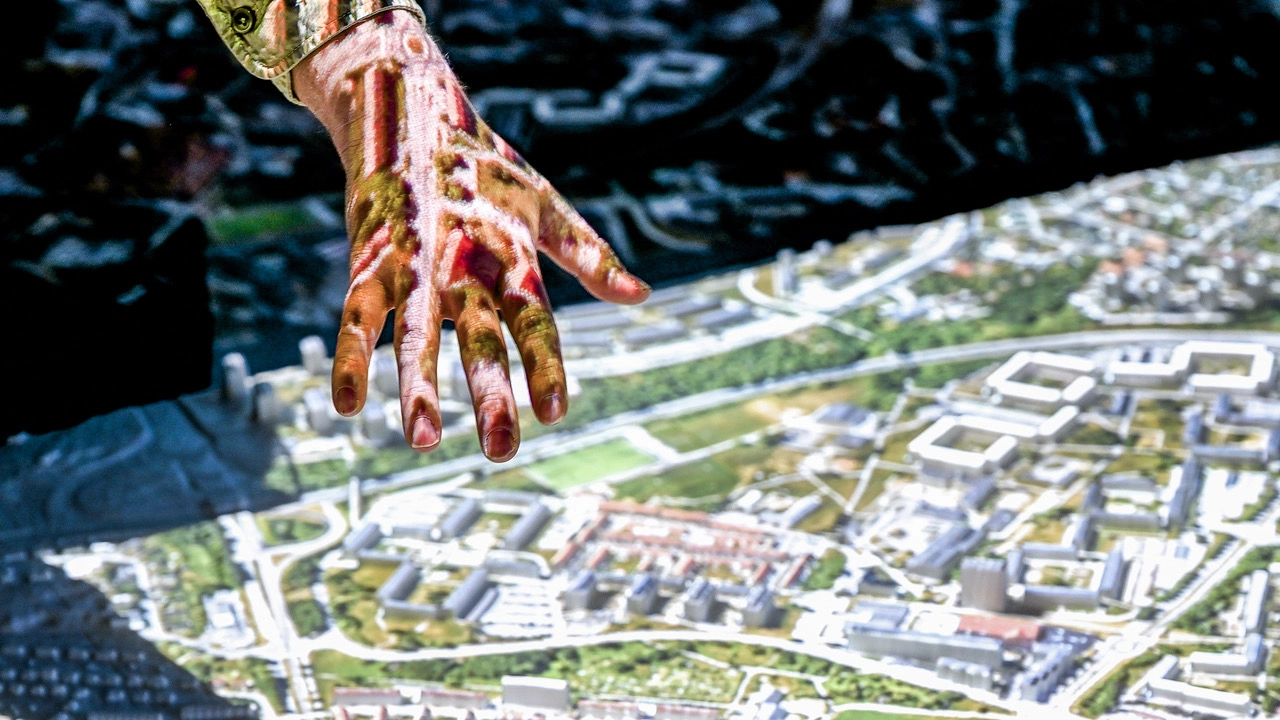
We who live in Sweden are constantly changing – we live longer, earn more, gain more and higher education. Or do we? This installation allows the exploration of data on all residents in Sweden from 1990 to 2017. Compare age groups, educational levels, disposable income, and origin in municipalities, counties, or all of Sweden and discover changes over time or differences between places. All analyses are based on longitudinal Swedish population register data, available at the Institute for Analytical Sociology (IAS) at Linköping University. The data collected from various authorities is organized by Statistics Sweden (SCB).

Conference
Let Insights be part of your meeting or conference with us at Visualiseringscenter C. Our educators will guide you and deepen your experience of the installations in the lab and learning environment. Read more about conferences here.
School Programs
Want to visit Insights with your school class? Our educators will guide you based on the students’ level of knowledge. Read more about school visits here.

About Insights
Insights is based on cutting-edge research conducted at Visualiseringscenter C and Linköping University.